Share
Share


Executive Summary
CIB revenue increased 5% in 2Q25--stronger performance largely driven by an uptick in Markets activity.
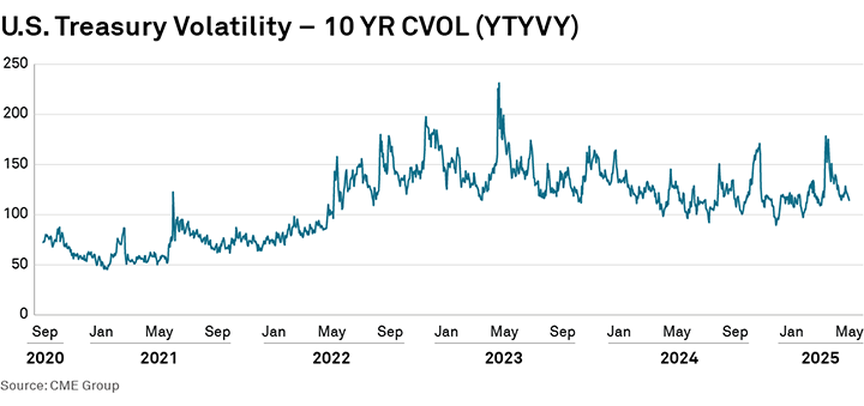
U.S. Treasury market volatility, or the amount that prices have or are expected to fluctuate in a given time period, has remained elevated since 2022 when the Federal Reserve began its rate-hiking cycle.
This prolonged period of uncertainty, despite an equity bull market that started in 2023, has surpassed the duration of heightened U.S. Treasury volatility observed during the 2007–2008 global financial crisis. Today’s sustained high volatility reflects the complex interplay of factors influencing the market and underscores the ongoing challenges and risks faced by traders and investors.
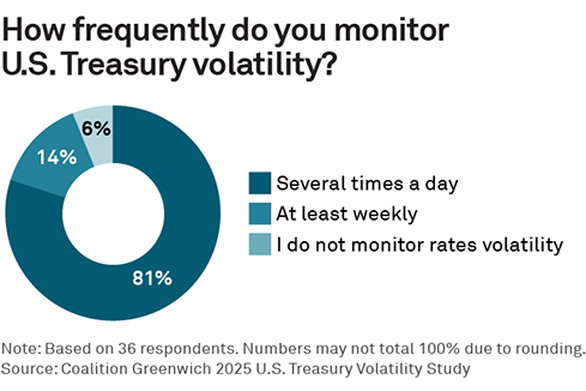
It is therefore no surprise that over 80% of the U.S. interest-rate market participants in our recent study monitor U.S. Treasury volatility at least daily, and 14% at least weekly, utilizing a combination of CME Group’s CVOL, ICE’s MOVE Index and/or internally developed metrics. Awareness of changes and trends in volatility is critical to finding alpha, profitably making markets, managing interest-rate risk and various other aspects of interest-rate trading and investing.
Utilizing volatility metrics is only as effective as the models and data used to calculate them, however. Fewer data points for the volatility model result in less frequent and less precise measurements. Until recently, limited data meant that broad-based U.S. Treasury volatility benchmarks had only end-of-day or infrequent daily updates—an approach that is wholly ineffective in today’s fast-moving market. Access to deeper datasets has allowed for rate volatility metrics that examine finer slices of the market in real time, allowing market participants to take on new strategies and better hedge risk.
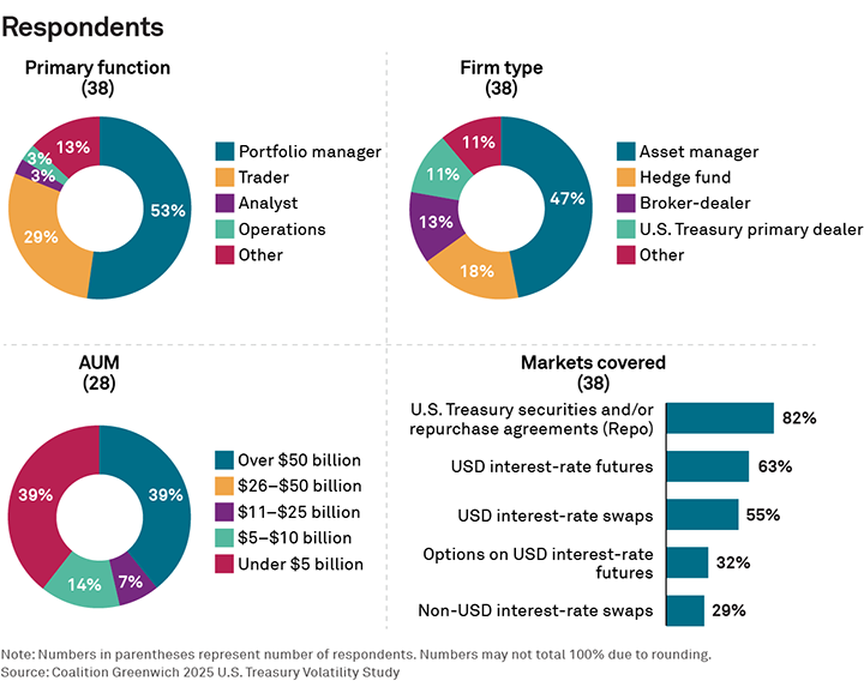
In an effort to better understand these trends, including how volatility data is used and measured by market participants, if and how they trade volatility, and what improvements they’d like to see in their volatility metrics, we interviewed 38 interest-rate traders and portfolio managers at asset managers, hedge funds, dealers, and market makers in the U.S. in Q2 2025. The aggregate result of those interviews reiterates the importance of volatility metrics and the increasing importance of real-time and data-driven models to support trading and investing decisions.
Volatility primer
Volatility in financial markets is defined as the actual or expected fluctuation in prices over a defined period.
Volatility is measured both historically and on a forward-looking basis. Historical (or realized) volatility is relatively easy to measure using actual, historical price movements over time. For example, the volatility of the 10-Year U.S. Treasury note over the past month is often measured by calculating the standard deviation of daily price changes, where each change is expressed as a percentage of the current price.

In contrast, forward-looking (implied) volatility is calculated using options prices, models or both to estimate expected volatility in the future. While the exact math is out of the scope of this research, options trade at higher prices when the implied volatility of the underlying asset is higher and vice versa. Put another way, if the future price of the underlying asset is more uncertain, then the insurance that an option can provide to the buyer is more expensive. As such, the volatility component of the price at which an option traded provides great insight into expected volatility in the future.
In efficient markets, the price of an instrument can be thought of as the market’s collective forward-looking expectation. For example, Fed watchers use implied rates from the swaps and/or Fed Funds futures market when discussing Federal Open Market Committee (FOMC) policy expectations, well demonstrated by CME’s FedWatch tool.1 The predictions are critical inputs for market participants, as they are based on real-time, transparent trading data, reflecting the activity of thousands of traders and investors in the world. The more volatility measures are held to those same standards, the more they will be relied on.
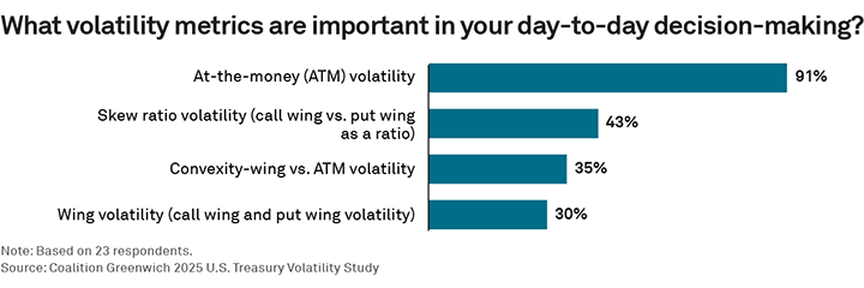
When analyzing market volatility, most participants (91% in our study) focus on ATM volatility, which measures volatility based on options with a strike price equal to the current price of the underlying asset (in this case, U.S. Treasuries). This provides insight into the market’s current volatility expectations.
Most traded options are not ATM, however, requiring adjustments to volatility inputs in traditional Black-Scholes pricing models to avoid significant inaccuracies for out-of-the-money (OTM) options. In practice, more advanced models are often used, treating volatility as a curve (how volatility changes vs. the strike price) or surface (how volatility changes vs. both the strike price and time to expiration), both of which account for deviations from the Black-Scholes model’s assumption of constant implied volatility.
Skew ratio volatility, used by 43% of our study participants, tracks and compares the call and put wings, showing how much more or less volatile the asset’s price is expected to be when prices are going up vs. going down. And lastly, convexity-wing and wing volatility look at the price differences between options with different strike prices to understand expectations for extreme volatility compared to ATM options.
While all of these metrics have existed for decades (the Black Scholes options pricing model was published in 1973), it is only recently that sufficient real-time data and compute power have existed to calculate and distribute their values in real time. Increasingly liquid options markets across multiple expirations, strikes and strategies have enhanced this data and improved volatility calculations greatly.
Why measuring volatility matters
Traders and investors monitor implied volatility to anticipate price changes and shifts in the yield curve, identify trading opportunities, hedge interest-rate risk, and predict potential liquidity challenges—just to name a few. Most of these items are important to nearly every fixed-income market participant, hence the 95% of our study participants that monitor volatility.
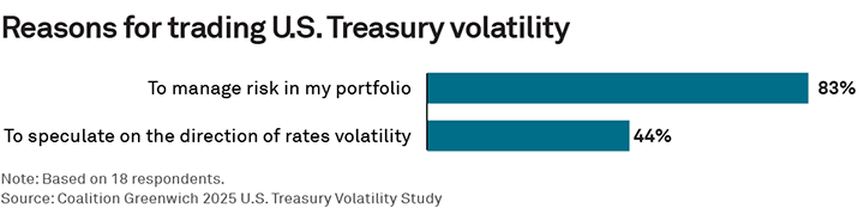
Some go a step further and actively trade volatility. Of the nearly 60% of our study participants who trade volatility, the vast majority do so to manage risk in their portfolio, while 44% are actively speculating on the direction of volatility. This is another strong reminder of why the quality of these indices matter. The best hedging strategy or insight into the market’s direction could be for naught if the benchmark used to implement those strategies is flawed.
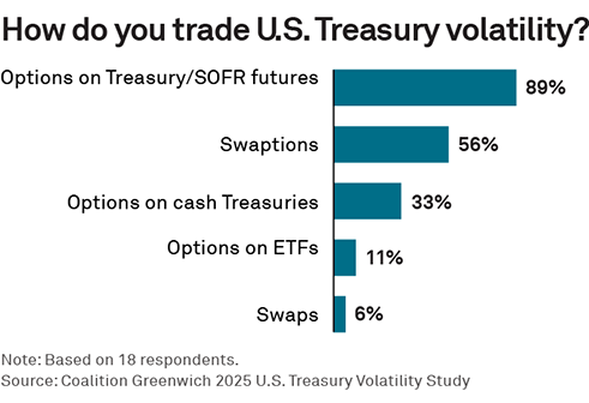
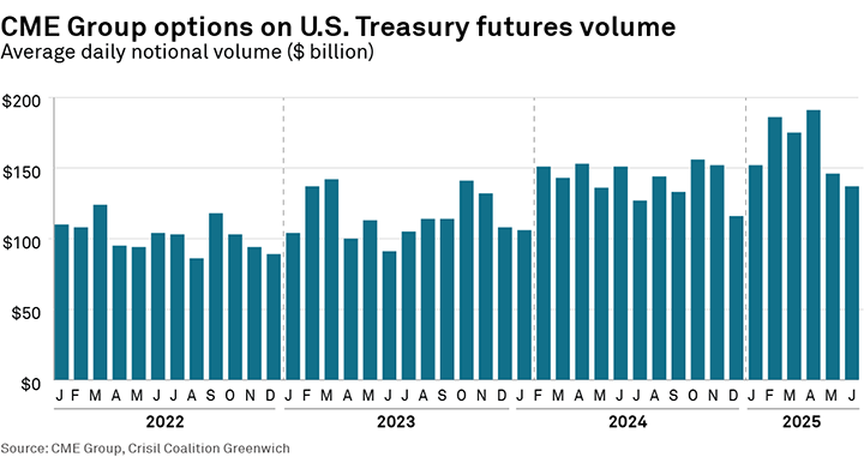
As discussed, options prices are a major input of implied volatility calculations, with the size of the options market critical to the effectiveness of that data. Therefore, it is not surprising that options are the preferred product for those trading volatility. Nearly 90% trade options on CME Group U.S. Treasury and/or SOFR futures. These exchange-listed products are the most easily accessible and have seen their volumes climb steadily over the past several years, up 32% from January 2022 to January 2025, and to nearly $200 billion daily. Options on U.S. Treasury ETFs are also exchange-traded, although this market is still in its infancy. Swaptions (options on interest-rate swaps) are used by over half of our study participants, but are a purely institutional product, as they require legal documentation between both counterparties of every trade, and there is less available real-time data.
Improving volatility data
The two most important aspects of U.S. Treasury volatility metrics cited by our study participants were real-time updates and the ability to measure volatility at different points on the curve. This makes sense, given the U.S. Treasury market’s rapid growth over the past several years and a market structure that allows market participants to react to news and market events more quickly. The ability to track wing volatility on the 30-year bond in real time, for instance, can offer traders and investors valuable insights, particularly in times of market uncertainty.
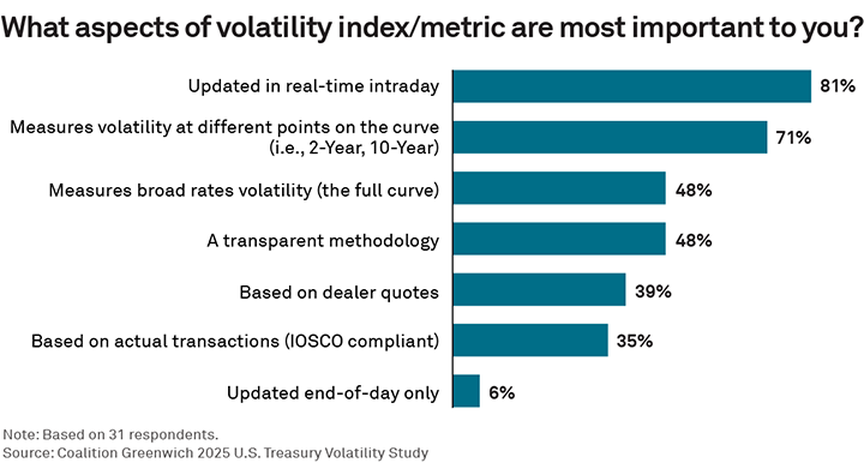
Insight into the calculation methodology of publicly disseminated volatility metrics was also noted by nearly half our study participants. To our early points about precision, using these indices to hedge or make trading decisions requires a deep understanding of what they are actually telling you—and that requires knowing how they are calculated. For example, the published methodology for the CVOL Index explains that an index level of 150 basis points (bps) indicates a 68% probability of a +/-150 bps range in a year from current levels, based on normal distribution assumptions. As U.S. Treasury CVOLs are a constant 30-day forward estimation, a 43 bps range for the next 30 days corresponds to an annual range of 150 bps.
Lastly, we found it fascinating that dealer quotes (where dealers say they are willing to buy and sell options) were given as much weight as actual transactions (where options actually traded). These two things are closely related, of course. On-exchange U.S. Treasury options trade when transparent and immediately executable prices are offered by dealers and other market makers. However, dealer quotes only become prices when the trade is done, implying a higher degree of conviction.
Whether markets remain volatile as they have been for the past several years or find a calmer path forward, measuring volatility and putting that insight to work in trading and investing will continue to be critical. The growth of the options market tied to U.S. Treasury prices has been supported by a diverse set of market participants, including asset managers, hedge funds, banks, and nonbank liquidity providers—all with different market outlooks and business models. This formula helps to ensure that market prices reflect the latest thinking and, as such, ensure implied volatility metrics act as a crystal ball for the days, weeks and months ahead.
Kevin McPartland is the Head of Research for Market Structure & Technology at Crisil Coalition Greenwich.
Methodology
In an effort to better understand the use of volatility metrics in the U.S. Treasury market, Crisil Coalition Greenwich interviewed 38 interest-rate traders and portfolio managers at asset managers, hedge funds, dealers and market makers in the U.S. in Q2 2025.